How Much Energy Storage Capacity is Needed for a Reliable Heat Supply?
Energy storage capacity, wind power, and energy security: what role does storage play in dependable heat supply? In this post, we share our simulation results for Polar Night Energy’s Sand Battery, powered solely by wind energy. Our findings reveal a broad range in required storage capacity—from 25 hours to several hundred hours—depending on the variability of wind power profiles.
Weather-dependent renewable energy sources like solar and wind are the fastest-growing forms of energy today. Renewable Energy Solutions (RES) are key to a sustainable energy system, but they come with a downside of high volatility that needs to be addressed.
This volatility disrupts the stability of the electricity grid and can even affect the profitability of renewable energy, as production peaks often drive the electricity spot price down.
As the world accelerates towards a future powered by renewable energy, the key to unlocking the full potential of wind and solar power lies in energy storage. In the future, it’s not hard to envision energy storage systems directly connected to wind and solar power plants to even out the fluctuations in production for better prices.
With our Sand Battery connected to a wind power plant, clients could electrify their heat consumption with only a small amount or even zero electricity required from the grid. A process requiring constant heat reliably throughout the year could be supplied with 100% renewable energy when coupled with Thermal Energy Storage (TES).
This raises a question: How large TES do we need to ensure that a certain level of heat demand is met?

Storage Capacity vs. Heat Demand Coverage
To find out how much capacity is required to cover most of the heat demand, we simulated the behavior of our Sand Battery in different scenarios while altering the storage capacity.
Storage capacity of TES is defined here as the number of hours the maximal charging power (i.e. resistor power) is needed to charge the TES from empty to full. This allows us to examine the results independently from the absolute size of the TES.
Let’s now consider the given wind power plant with 3 different wind profiles:
- Wind power peak: 10 MW
- Wind power profiles (yearly average power): Finland (3.3 MW), Denmark (4.1 MW) and Germany (2.3 MW). Wind power profiles from 2019.
- Heat demand profile: Constant, 90% of the average power of each wind profile
- Maximal charging power: 6, 8 and 10 MW (60, 80 and 100% of wind power peak)
- Simulation period: 1 year
The heat demand is constant and set to 90% of the yearly average of each wind power profile, so that the relative level of heat demand is same for all wind profiles.
The simulation is performed with 3 different maximal charging powers for each wind profile. Smaller maximal charging powers allows not only smaller resistors but also smaller piping, which might be more cost efficient due to the small number of hours with peak wind power.
Heat losses are not considered.

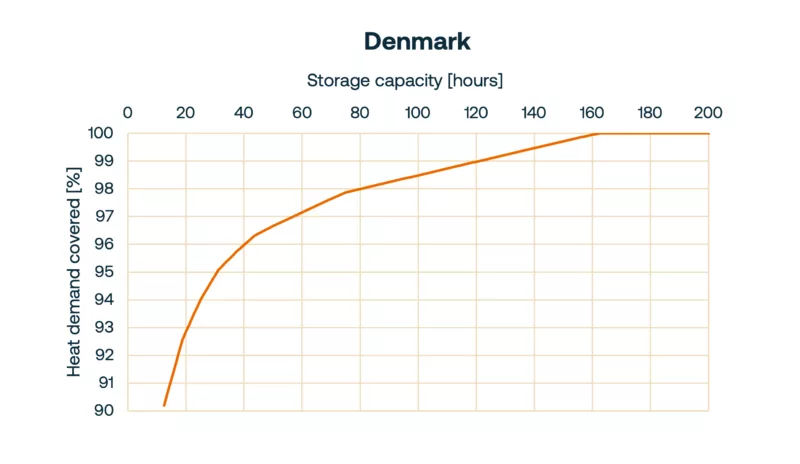
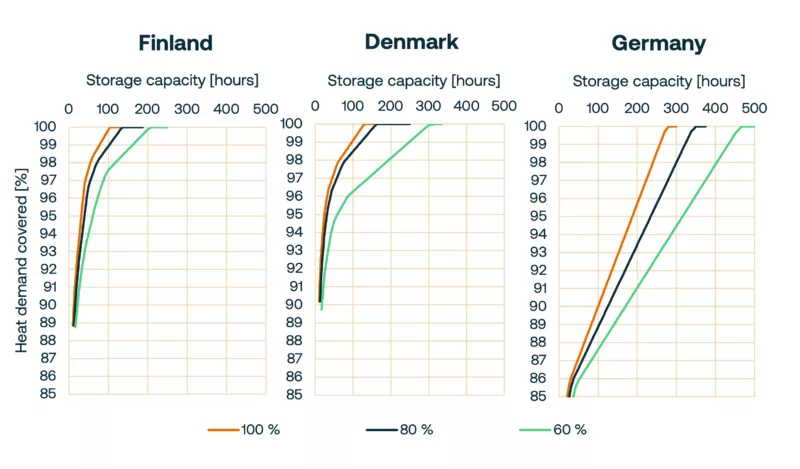
From the graphs in figure 2 we can choose a level of heat demand coverage and find out the required storage capacity for a given maximal charging power and wind power profile.
In table 1, the simulation results for 95% heat demand coverage are presented. In this case, 5% of the heat demand ought to be covered by alternative energy sources.

Irregular Wind Profile Increases Need for Storage Capacity
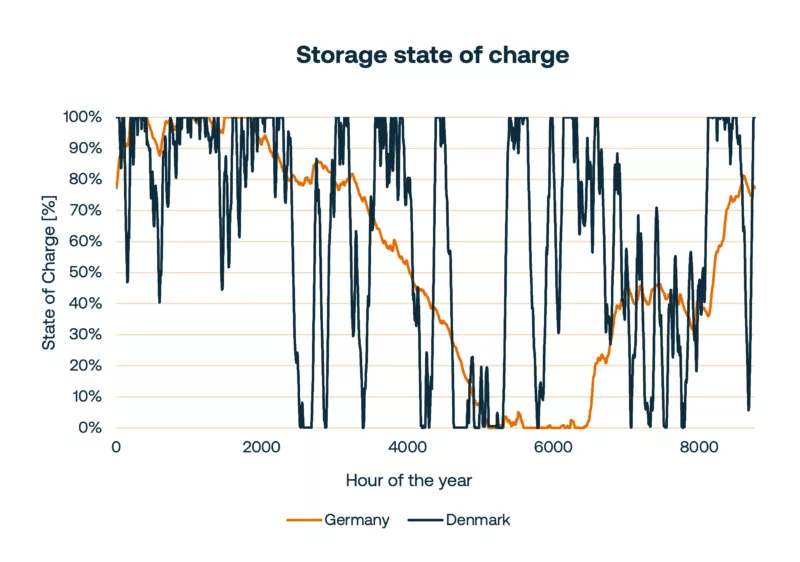
To better understand the results, let’s plot graphs of the storage State of Charge (SoC) with the wind power profiles of Germany and Denmark. Figure 3 shows how the storage SoC evolved through the year.

In figure 3, the maximal charging power was set to 80% of wind power peak and the capacity of the energy storage was set high enough to achieve 95% coverage of the heat demand.
We can see that with the wind profile of Germany, the storage state-of-charge drops for a long time, indicating a long low wind period and further causing the need for a large storage capacity, which was seen in the results.
In contrast, with the more even wind profile of Denmark, the storage can use its capacity much more efficiently, having multiple full cycles through the year. This is a result of needing a much smaller storage capacity.
From table 1 we can recall that the storage capacity for Germany in this scenario was required to be 240 h, while for Denmark it was only 30 h – an eightfold difference!
Hence, the shape of the wind power profile has a significant impact on the amount of energy storage capacity required, when we want to maintain the same heat demand coverage.
More perceptive readers might have noticed that the initial and final state-of-charge is different for different simulation scenarios. Why is that? It happens when we iterate the initial state-of-charge to match the final value. This way the amount of energy going in the storage during the year is the same as the amount of energy taken out of the storage.
Outcome
Of course, the simulation results should not be taken at face value. Truth lies most likely somewhere in between those cases, probably closer to the results of Finland and Denmark than the results of Germany.
Also, perhaps even smaller storage capacities could suffice, but it would mean that we had to relax on other goals, e.g. build a larger wind power plant and raise the maximal charging power or lower the level of heat demand coverage. But these are cost optimization problems that were not studied here.
Here the focus was on the question: how much storage capacity is needed to cover most of the required, constant heat demand when supplied with intermittent wind power?
The answer seems to be: minimum of 25 hours and up to hundreds of hours.
Curious to learn more? Stay tuned for our next post about the value of storage capacity.
Author: Ville Kumpulainen, Polar Night Energy, Trainee
Get Started
Are you ready to switch to clean, affordable energy and fight climate change? Start your journey with us.
